
What’s it all about?
A technique for identifying the most important clients/products/issues in your business so that you can focus on the most significant things first.
I like this topic, it’s easy, relevant to most businesses and I have a seminar question which allows me to use an outrageous pun.
It is often found that a large proportion of the value of something is accounted for by a small percentage of something else. For example, 80% of your sales come from just 20% of your products which obviously means that he other 80% of your products are only giving you 20% of your sales.
This is often called Pareto Analysis after the first person to describe the effect, Vilfredo Pareto whose work first looked at the distribution of wealth in societies.
http://en.wikipedia.org/wiki/Vilfredo_Pareto
Wealth in the UK is mostly held by a small number of people.
Most of your sales will be to a small number of your total customers.
Most of the profits from sales will be from a small number of your products.
It has also been observed many times that 80% of something is attributable to 20% of something else. The frequency of this pattern has lead to it often being called the 80:20 rule.
Apart from just being an interesting observation, it does give you the opportunity to understand your business better.
If you know that two out of every ten customers are more important to you than the other eight, then you might focus your work more if you know which two they were.
We tend to look at a business as a whole. Using Pareto Analysis allows us to identify the most profitable customers, products, services, locations etc.
This will enable us to focus our efforts and resources on these.
Remember, it is harder to get a new customer than to keep an existing one. You need to know which customers to focus on keeping. Some customers and products you can afford to lose (or should actively get rid of).
Don’t assume that the 80:20 rule is an absolute though. There are other patterns that are found in practice. 50% of results from 5% of the total and 20% from just 1% of the total have been regularly seen.
This is why we would use the calculation technique to see what would have applied in our own business scenario.
You can use the method to determine who are your most important customers, best products, locations etc., but you can also use the process to work out which customers cause you the most problems, which products have the most defects, what’s worst etc. Same method, just a different interpretation.
Watch this.
(Remember, videos like these that are produced to cover whole topics may include material that isn’t relevant to your own exam at your institution.)
Easy first video as no maths!
Does repeat the 80:20 ratio (which isn’t universal)
Demonstration of construction of a Pareto Chart in Excel.
You of course need to be able to do it on a piece of paper for an exam. And again, a focus on 80:20 which doesn’t always apply.
Another assuming the 80:20 rule is a rule, but shows a graphical alternative to what I teach.
Like so many examples there seems to be an assumption that the ratio will be 80/20. We know it doesn’t have to be.
I do accept that it is easier to write a question when you know what you want the answer to be. 🙂
Another demonstration:
Doing Pareto Analysis to identify our biggest problems (rather than our best options).
And another
A guide to constructing a chart as a visual representation. Does repeat the misunderstanding that it will be 80;20. It can of course be any ratio.
https://bin95.com/Pareto-charts-80-20-rule.htm
Practice Questions
(These aren’t mine, but should be useful for you. Do remember that different teachers may use different techniques and different terms).
Further Reading.
Pareto Analysis
An interesting discussion about alternative ways of charging passengers to cover carbon emissions in…
Posted by Management Accounting Info on Sunday, 19 December 2021
The 80:20 rule has been taken up by the self-help movement as it is a sensible way of focusing on the most important things.
The best known, probably the person who popularised the use of Pareto Analysis for development is Richard Koch.
He has his own Youtube channel: https://www.youtube.com/channel/UCOpPHBW48rgQ2KDnEzePqeg
The 80 20 Principle had a huge impact with follow up books such as The 80 20 Manager demonstrating how you could use the ideas in your career.
An example from the Dating industry.
Text of an email shared with me by an accountant friend.
|
|
|
|
Pareto Analysis.
An example from University recruitment showing what a small percentage of courses recruit the bulk of…
Posted by Management Accounting Info on Wednesday, 25 November 2020
Issues in Healthcare
Not everything is 80:20.
With the numbers given in the article it’s not possible to calculate any full Pareto Analysis Ratio here, but we are given 0.4:4 for visits to Accident & Emergency. 0.4% of patients cause 4% of visits.
The report is essentially using Pareto Analysis to identify issues and then develop solutions.
You can’t abandon patients in the way you could drop customers or products, but you can institute procedures to manage their visits. Notice here that the high level of visits is partly being attributed to failings in provision elsewhere in the Health Service.
Using Pareto Analysis in your business.
Discussion of using Pareto Analysis to help a company develop. It uses the usual 80:20 ‘rule’ as if it an actual rule rather than a common occurrence. But it is still interesting on how the process can be used.
http://www.accountingweb.com/practice/clients/how-to-steer-clients-toward-profitable-growth
Wealth ownership
Pareto’s initial work was on income/capital ownership inequality. Something that is largely worse now as alluded to in this cartoon by Dave Brown in The Independent 20/1/15.
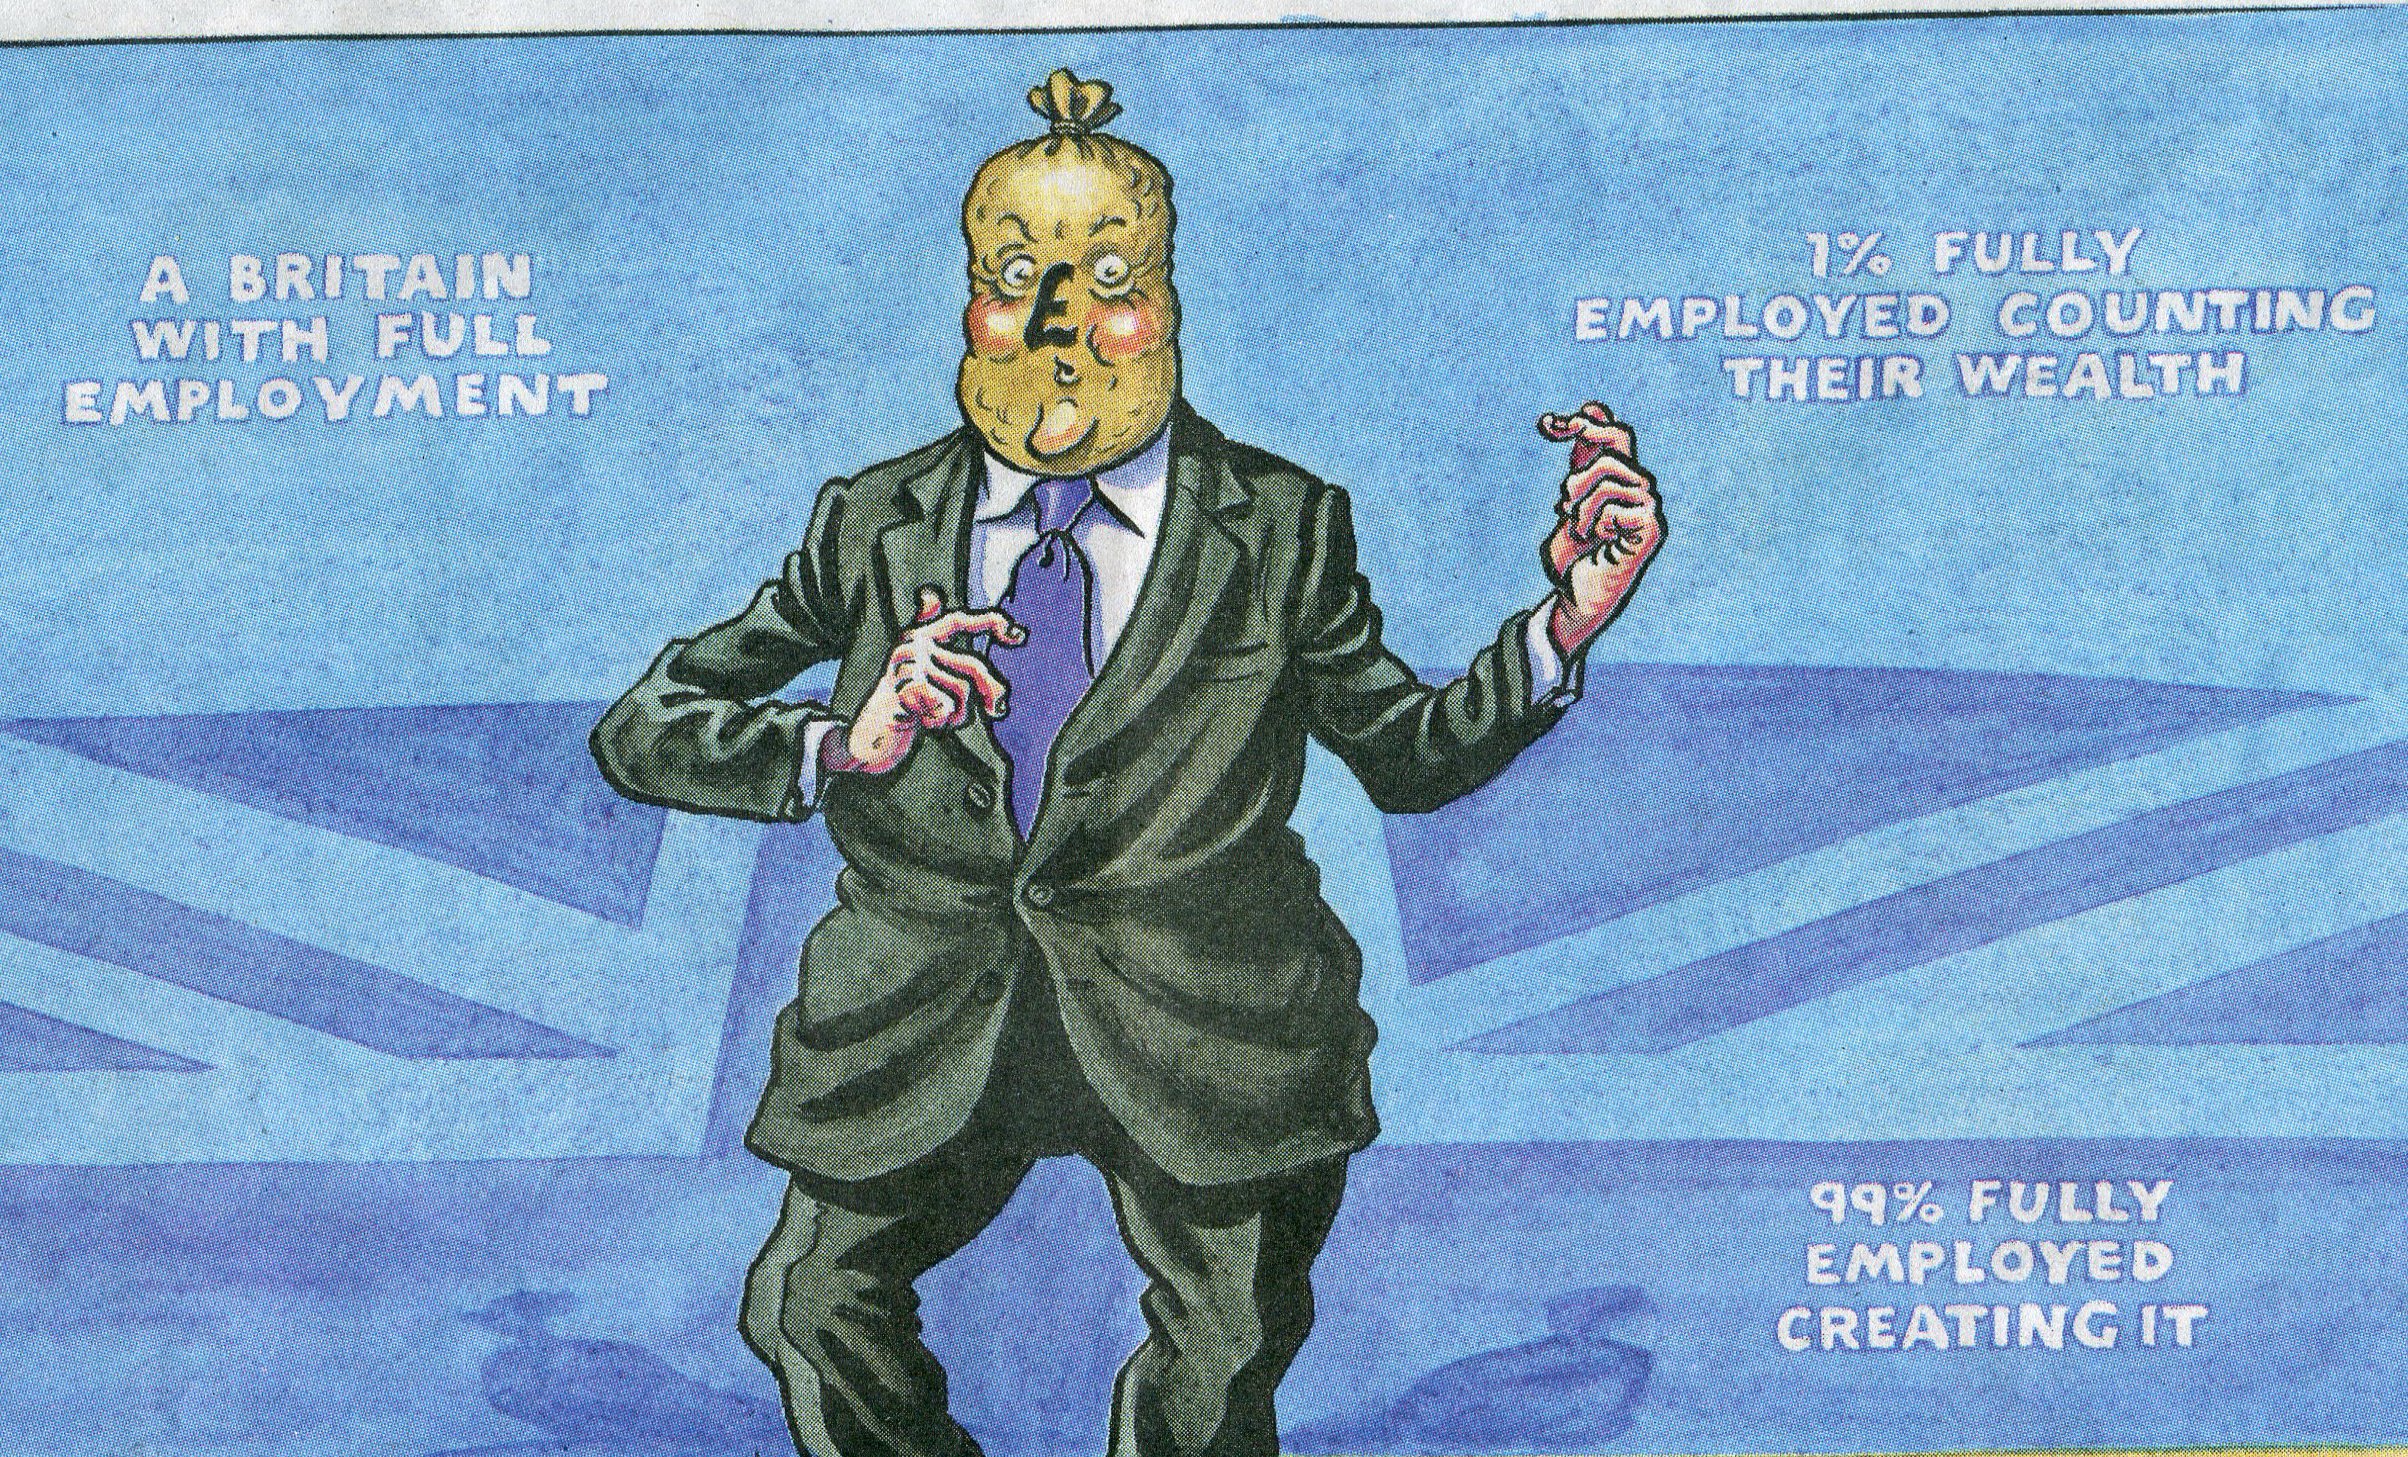
That’s how he ‘cartoons’ David Cameron.
Pareto first came up with the 80/20 “rule” looking at ownership of wealth in Italy.
If he did it now on global wealth it would be the 1/50 rule.
Using the Pareto Principle (80/20) rule in your personal and business life.
Who is causing the problem?
A ratio of 50:10 here. With members of the richest 1% generating 175 x as much as the bottom 10%.
What’s the ratio for the world?
Vilfredo Pareto’s initial work on wealth disparity in Italy gave us the 80:20 ‘rule’. 80% of the wealth held by 20% of the people.
Now it is 50% held by 0.000000008% of the people (a bus load!).
Pareto Analysis The Simpsons Voice Actors
Possible Written Questions.
(No indication of marks – the more marks a question gets, the more you are expected to write – detail that is, not just words!) If you can’t answer these, you need to do some more reading. I do ‘find’ questions elsewhere, so these aren’t all questions I have used myself.
Discuss how and why an organisation might use Pareto analysis in decision making.
Explain the circumstances in which it would be useful to conduct Pareto Analysis on management accounting information you have for your organisation.
What is the significant difference in the interpretation of Pareto Analysis data when you are using Pareto Analysis to analyse problems (e.g complaints, failures in a system, rejects etc.) rather than benefits (e.g. sales).